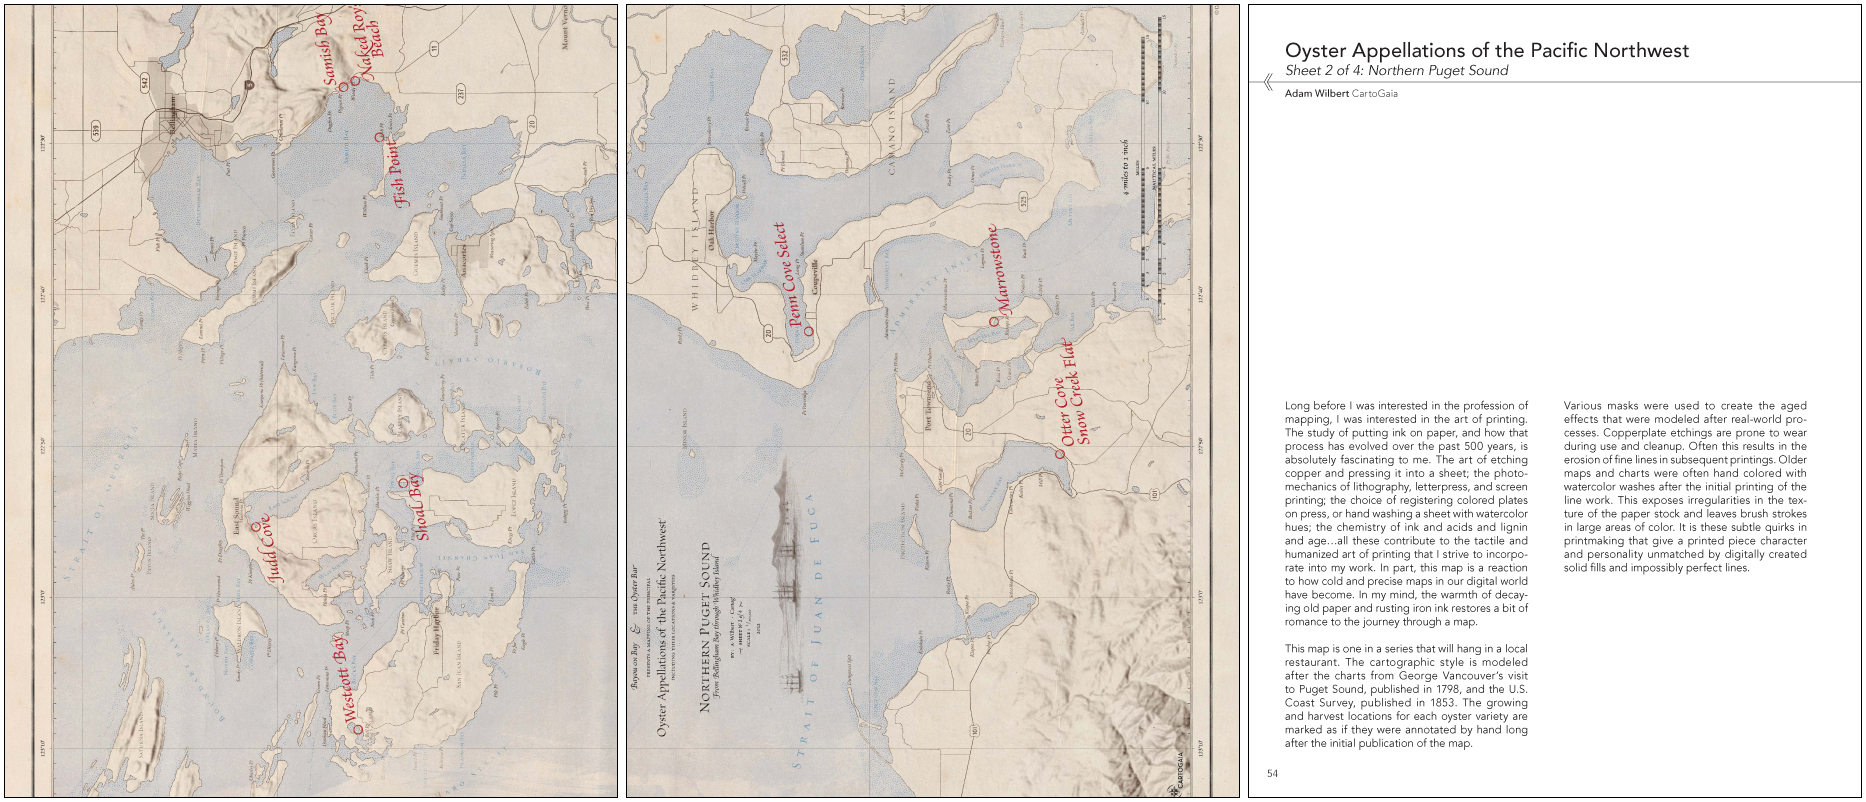
For the second in our series of short interviews with Atlas of Design contributors, we bring you Adam Wilbert, the mastermind behind Oyster Appellations of the Pacific Northwest, Sheet 2 of 4: Northern Puget Sound. Adam is a cartographer, photographer, teacher (check him out on Lynda!) and principal of cartoGaia. After seeing his work here and in the book, you will surely want to follow him on Twitter.
Atlas of Design: After the inevitable robot takeover, you are hired to teach cartography to our new digital masters. What is their first lesson?
Adam: 010100110111010001101111011100000010000001110100011010000110100101101110011010110110100101101110011001110010000001100001011000100110111101110101011101000010000001110000011010010111100001100101011011000111001100100000011000010110111001100100001000000111011001100101011000110111010001101111011100100111001100101110
You read that right. Stop doing that. I would instruct the robots to bring in more tactile emotion mixed with a helping of heart. Then I would point and laugh and increase my fees.
AoD: Why did you put this map on ice for a time?
Adam: I’m sure it’s the same with most cartographers—and freelance designers in general—that you always have some pet projects in the mix when a big priority and time-sensitive gig jumps the queue. So in part, this project got bumped because of that. On this map it actually gave me more time to work on new techniques involving actual real life brushes and ink washes and—gasp—paper. Real paper. Everything was eventually scanned into the computer and composited on screen through various opacity masks and overlays, but there is a human’s touch at the core of these maps, which is why I think they’ve been received so well.
AoD: This map was made to hang in an oyster bar you frequent. Are you planning on making maps for other kinds of food you eat?
Adam: I am actually really interested in the geography of food. At one level are the distribution channels that bring ingredients from the farm to our tables. Unfortunately, it feels like people are only interested in where their food comes from when there is a contamination event and it suddenly becomes very important to know exactly where your cantaloupe came from. One pet project I’ve been kicking around is to map the assembly of a hamburger, and look at how those patterns shift for various locations around the country.
At another level, the geography of food encompasses the French concept of terroir, or the “taste of place,” which I find equally fascinating. The idea is that unique combinations of temperature and soil chemistry and rainfall and all of the other elements that go into growing or raising food are expressed in the subtle variations of the end product. With oysters, these factors include the depth and temperature of the water, direction of the current, whether the oysters are raised entirely at depth, or if they spend a time in shallows. Resource constraints didn’t allow me to explore that with the oyster maps, (ultimately, the maps weren’t supposed to stand alone anyway as the servers at the Oyster Bar will use the maps to discuss growing conditions and how it affects the variety with their guests) but it’s something I’d like to incorporate into a future revision of the series.
Even more interviews are on the way as we count down to the official release of the Atlas! To keep up to date, subscribe by email or RSS using the links to the right, or follow us on Twitter and Facebook.
